
LOCATION
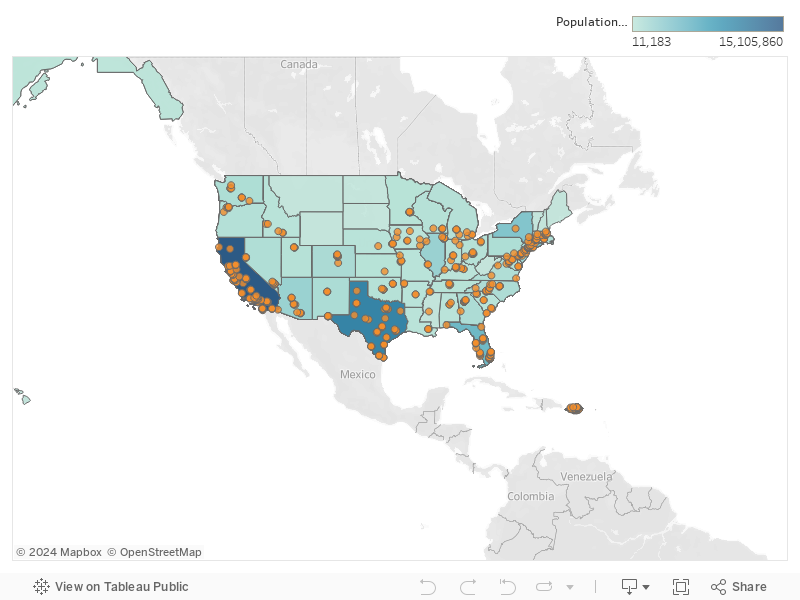
How do demographics inform the news media landscape? This is the first question we set out to answer when we started our research. We looked state-by-state, assuming that the Latino demographic map would overlap precisely with the Latino news media map.
In some cases it did:

California has the largest Latino population, 15 million people. At 39 percent of the state’s population, it is the largest “ethnic” group in the state (and accounts for more than 25 percent of Latinxs in the U.S.). Ninety-one of the outlets we identified are in California, the largest number in any state and more than 16 percent of all outlets we found (not including those in Puerto Rico).
Texas is the second-largest Latino state, with 10.6 millions Latinxs who make up 39 percent of the state’s population and 18 percent of all Latinxs nationwide. We found 63 news outlets there, 10 percent of the total.
New York comes next, with 3.7 million Latinos, or 19 percent of the state’s population. We found 48 outlets there, more than 7.7 percent of the total.
But in several cases, there was little or no demographic overlap.
In one instance, the Latino news media presence was surprisingly robust, given the demographics. North Carolina ranks fifth in our news media map, with 23 outlets, yet it has only the 11th-largest Latino population by state, roughly 915,000 Latinxs. (The abundance of news outlets might be explained by the wide geographical dispersion of the Latino population in cities and rural communities.)
In other cases, there was a dearth of outlets, given the potential audience. Illinois ranks fifth in terms of Latino population, with almost 2.2 million Latinxs, but we found only 10 outlets there.
Mississippi has 88,000 Latinxs, but we found only one news outlet there, La Noticia, a free print publication.
All the states in which we identified zero media outlets have Latino populations. Latinxs make up around 10 percent of the population in Wyoming and Hawaii, for example.

Does this mean we’ve identified news deserts in those states in which there are very few or no outlets serving the local population? Certainly that’s the case for states with a significant Latino population but zero outlets. But it may be that Latinxs in some states get their news from non-Latino news sources. That could be true, for example, in New Mexico, where almost half the population is Latino (the largest state percentage in the country) but where only three Latino media outlets exist, all of them Spanish-language local TV stations. (Two of them are Univision’s; one is Telemundo’s.) New Mexico’s Latinxs are overwhelmingly U.S. born (over 90 percent). And although more than 55 percent speak Spanish at home, they may not identify with news companies that see immigrants as their main audience.


Another reason to be careful about identifying deserts is that we lack information from the audiences these outlets purportedly serve. In other words, we haven’t yet asked the public. California’s Bay Area, for example, has four Spanish-language newspapers and two local news stations run by Telemundo and Univision. This might make one conclude that there is an abundance of news for the local Latino community. But a survey conducted by local journalist and media entrepreneur Madeleine Bair found that the Spanish-language community in Oakland with access to those outlets feels ill-served by them. (For more on that, and on a leading-edge local-news solution in Oakland, see our Outstanding Innovation Models section.)
Our planned nationwide focus-group survey, slated for later this year, will teach us more about how Latinxs get their news and how they assess the news they receive (or don’t) from Latino news media.
